This manual explains how to install Wazuh and Logstash separately. If you want to install both applications at the same time, just follow the steps in section «2. Download and Execution” and choose “Wazuh” and “Logstash” when you are asked to choose the applications that you want to install.
1. Download and Execution #
- Download the main program called ApoloInstaller.exe. It is recommended to place it in a folder that is known and accessible.
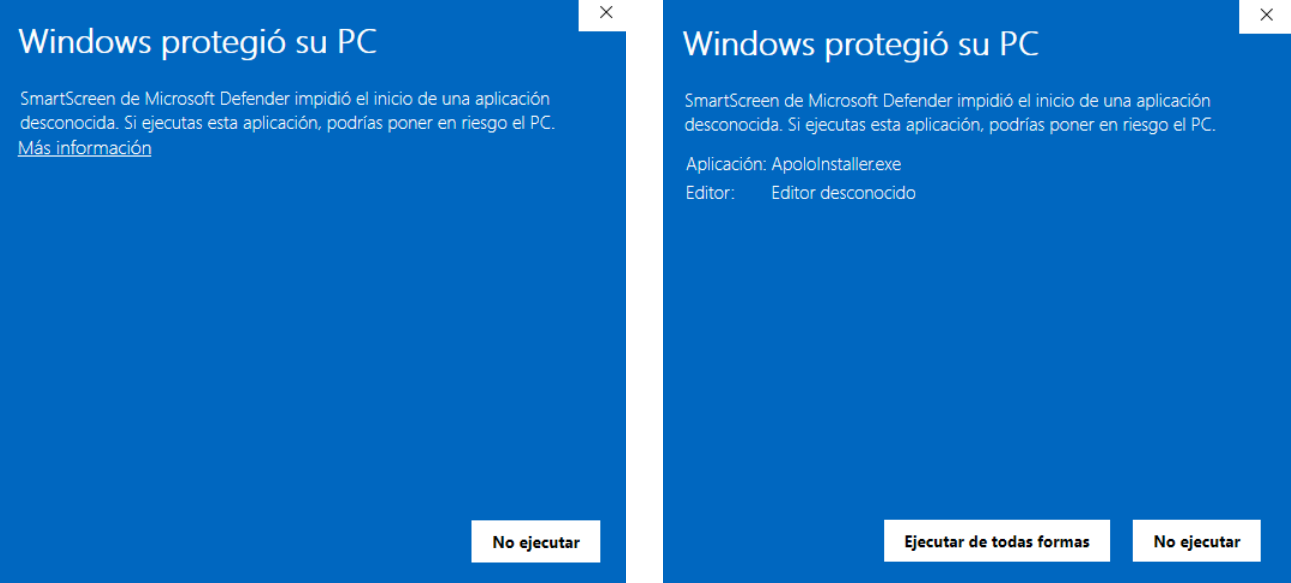
- Run the program and accept the windows that appear during the process. It should ask for Administrator permissions. If not, it is recommended to right-click the Installer and run as Administrator.
- In case Windows detects it as a threat on the next screen, click on «More information» and «Run anyway».
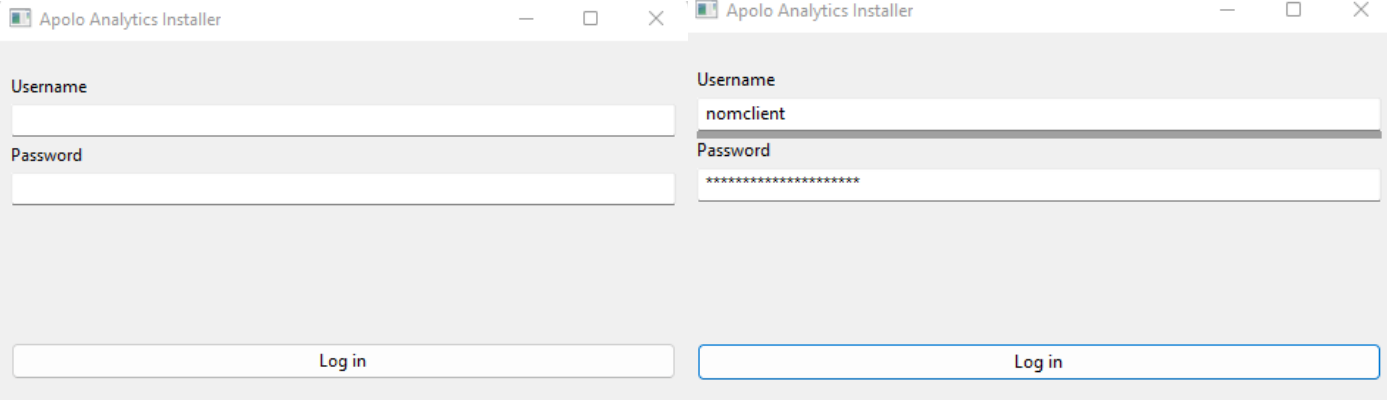
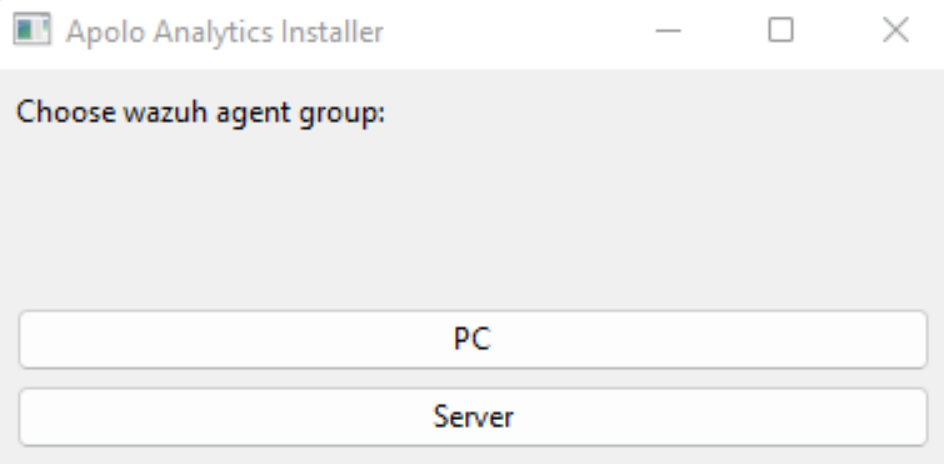
4. The following screen will appear where we will have to enter the credentials provided by the organization to verify and receive the data necessary for the correct installation.
In case of error because it has already been installed previously, we will follow the following steps:
5.3. Delete “Wazuh Agent»
5.4. We proceed to point 2. to return to installation
6.1. In case of error during authentication, the following pop-up will appear, and we will return to point 2.
7. It is advisable to put different names on the machines during the installation to facilitate in the future where the attacks and vulnerabilities come from, but it is optional.
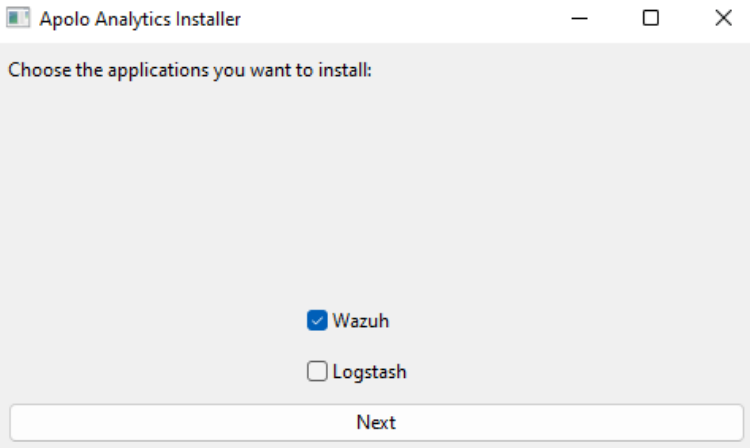
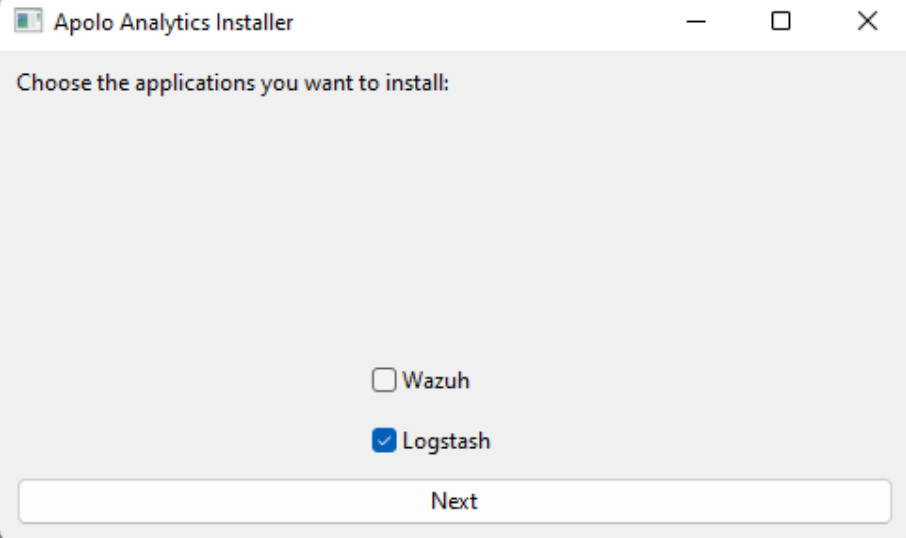
8. The following window will appear, where we will have to choose «Wazuh”
9. We will wait for the download until the screen appears indicating that the installation has been successfully completed.
2. Verification of the installation #
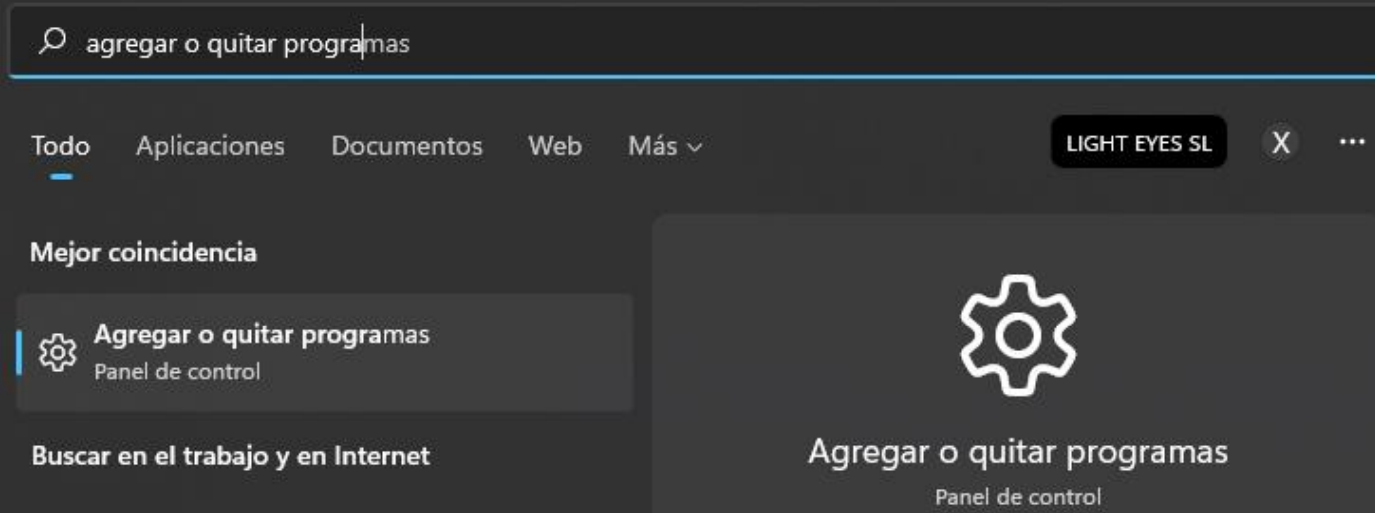
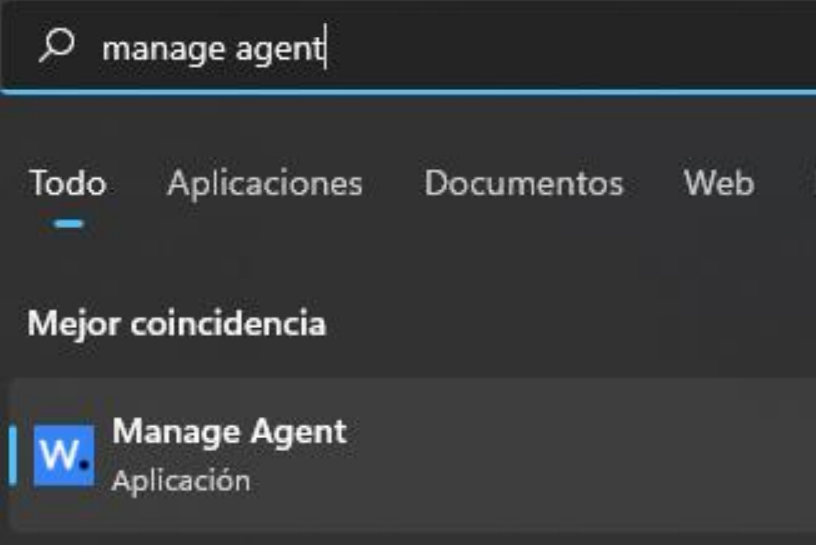
- To verify that the installation has been successful, we will carry out some checks. In the Windows search engine, we will search for «Manage Agent».
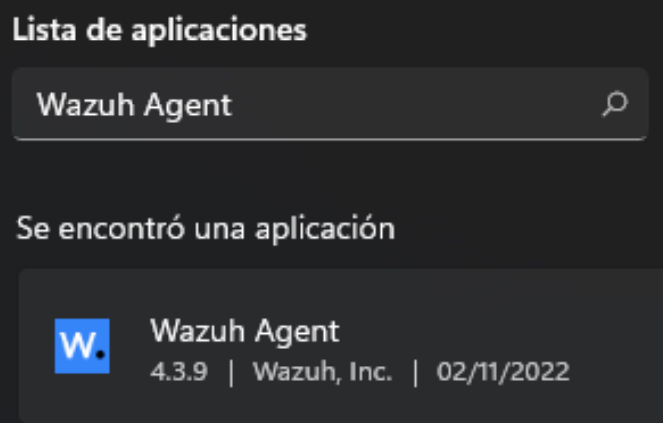
- We will verify that «Authentication key» contains a sequence of characters. Sometimes it is necessary to click on «Refresh» and in the tab «Manage» > «Restart» if the installation was very recent.
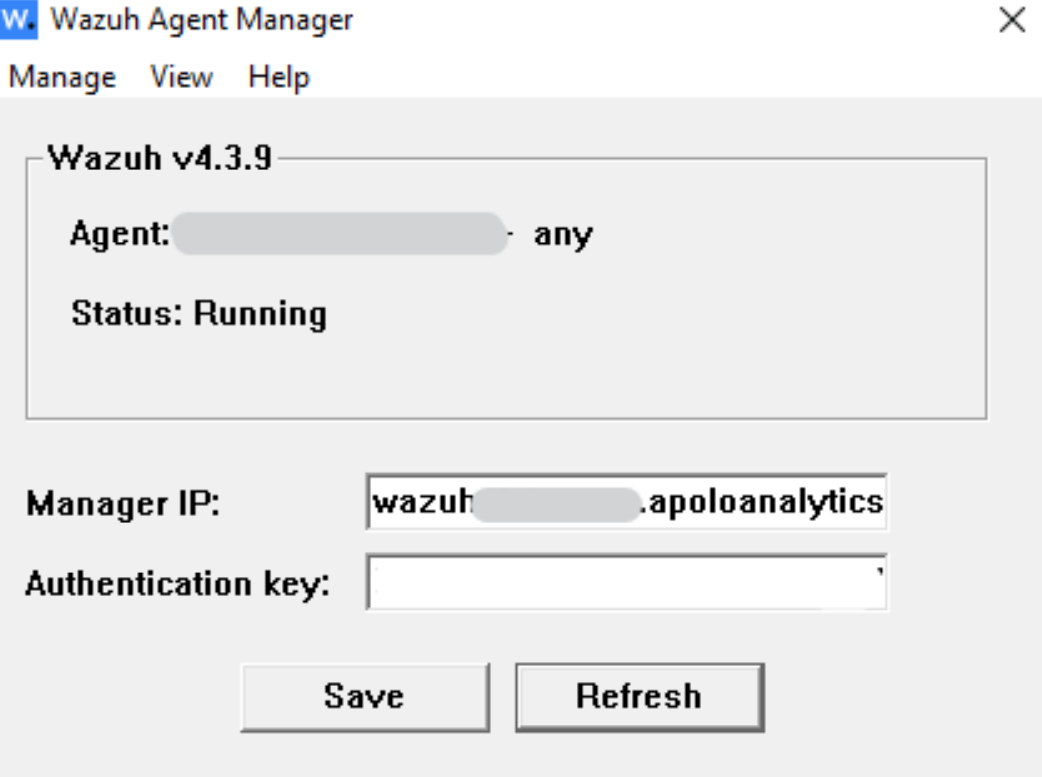
- In case of not appearing, we will have to restart the PC or Server and check again after a few minutes.
3. Checking the installation #
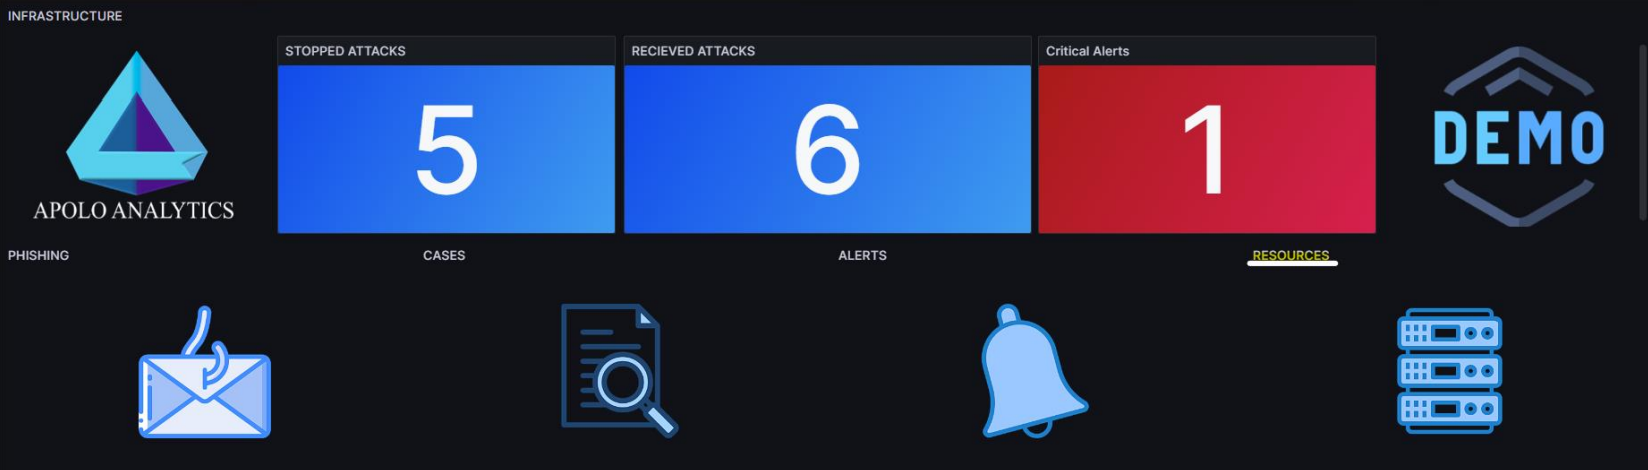
- We go to our dashboard environment at the following URL: company.apoloanalytics.com We
will access our main dashboard, where we will find a button called «Resources,» where if we
have installed Wazuh on PC computers, we should see them in the visual graph with the
names of PCs:
 2. If in the list we see the servers on which we have installed the agent and the graphics show the data, the installation has been carried out correctly.
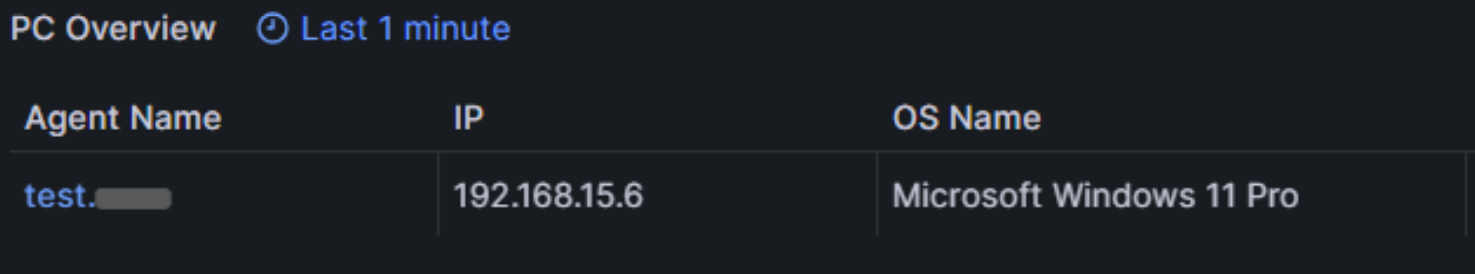
- If we click on a PC or Server of the dashboards shown above, we can see the detail of that device:
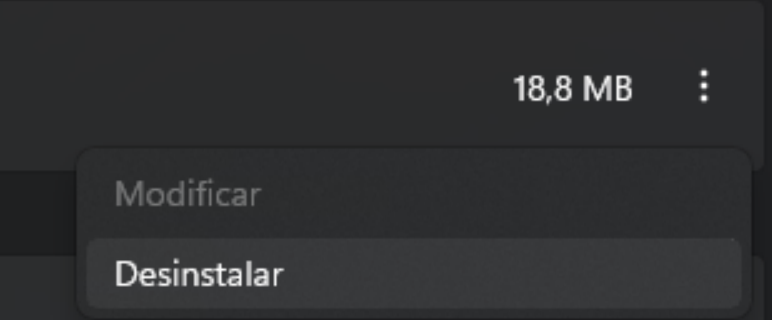
4. Uninstall Apolo #
In the event that it is necessary to uninstall Apolo, to proceed with the uninstallation, go to section «2. Download and Execution» in subsection 5. Until 5.3.
5. Logstash Apolo installation #
We carry out the steps 1, 2, 3, 4, 6 i 7 of the section 2. Download and Execution. Once we do it, the following window will appear:
We will select Logstash and wait for the download to be made:
Finally, a window will appear as in section 8 of 2. Download and Execution. We will select “Finish» and the download will have been completed correctly.
6. Logstash Apolo configuration #
The installation of Logstash and its service is located in the ‘Apolo Analytics’ folder, at the default address: ‘C:\Program Files\Apolo Analytics’.
- To correctly configure Logstash, once we are done with point 5. Installation Logstash Apolo. We will have Logstash with a default configuration however, we will have to add it according to the needs.
- We will enter the folder of ‘C:\Program Files\Apolo Analytics\logstash-version. Where we will find the following files:
- The file that we will need to modify is ‘logstash.conf’ located in the previous location which will have a configuration similar to the following.
- By default, we have port 5144 as input. We will have to configure the output of the logs of our systems such as those of Firewall or Switch on port 5144 with UDP protocol, so that they reach Logstash. If we want to use another port, we will also have to change it in the input.
- By default, we also have port 514 to send the logs to Wazuh. We will check that the nomclientempresa is our company name and it is correct. We recommend NOT to change this port 514 with TCP protocol. It will travel encrypted on the correct port to apoloanalytics.com.
- Finally, the filter section that will be used to modify the format of the logs in the correct format for Wazuh to generate alerts. If we get different sources that we want to format, we will have to separate them with ifs as follows.
if [host][ip] == «192.168.X.X» {
}
Among the («») we will place the ip from where we receive the logs (example: Firewall, Switch, …).
NOTE: The default configuration allows the transmission of any log format, the formatting is used so that Apollo can distinguish the different variables of a log and be able to make a correct correlation with other logs.
Example for Fortigate Firewall:
if [host][ip] == «192.168.X.X» {
grok {
match => {«message» => «%{SYSLOG5424PRI}%{GREEDYDATA:message}»}
overwrite => [ «message» ]
}
}
By adding the grok in the if, it is enough to correctly receive formatted and sectioned logs.
6.1 Port configuration #
In case of we want to change our port, we must know two things. First is that Logstash is externally installed from the “ApoloInstaller”, that you can find clicking here, and we must generate a new rule inside the input firewall on our team. If not, we will receive no messages.
While installing our “ApolloInstaller” we generate a rule that allow us the input with de 5144 port by UDP protocol. In addition, a service is generated to run the program on the one hand automatically with the start of the system and on the other to be able to run it in the background without having to have the window with the program strictly mandatory.
To change our port configuration in our log or logstash server, two actions will be necessary.
**IMPORTANT Administrator permission.
To begin changing the configuration of “logstash.conf” on “C:\Program Files\Apolo Analytics\logstash8.5.0” or you can open it directly here. We will change the chosen port on the top of the configuration, inside the “input” mark:
input {
udp {
port => 5144 //This is the port that we wish to change for.
}
}
*RECOMENDATION: if we want to make changes, to check those ones, we recommend putting in the following lanes on the output mark to print the exit on a file. We will change the PATH of the location where we want to show the file. Once done we will delete it.
file {
path => «PATH»
}
Should view like that:
output {
stdout{
codec => «line»
}
file {
path => «PATH\logstash.log»
}
tcp {
codec => «line»
port => 514
host => «wazuh-.apoloanalytics.com»
}
}
The next step to do would be to change the input rule of the Firewall. To do it we’ll execute the following command on Powershell as Administrator where we will only change the value of the configuration “LocalPort” for our wished port.
Set-NetFirewallRule -DisplayName ‘Logstash’ -LocalPort 514
If our command doesn’t work, we go to Firewall Windows Defender > Advanced Configuration > Input Rules and look for “Logstash”. Then, on Protocol and Ports, we’ll changed for the port we want.
 by Apolo Analytics